Sample analysis
What the numbers can reveal.
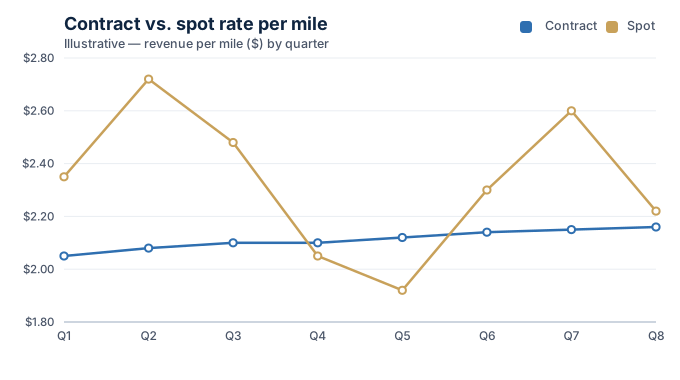
Contract rates hold steady while spot rates swing with the market. We show how much of the margin is riding the rate cycle.
Fleet costs, rate mix, and driver dynamics make transportation earnings tricky. We get into the per-mile detail.
Transportation is asset- and labor-heavy, and margins turn on details a standard review skips — revenue per mile, contract-versus-spot mix, fuel pass-throughs, and driver retention.
We rebuild lane- and load-level profitability, test fleet capex and utilization, and separate durable earnings from rate-cycle noise.
Typically delivered through: Quality of Earnings · Due Diligence · Operational Excellence
Contract rates hold steady while spot rates swing with the market. We show how much of the margin is riding the rate cycle.
On a buy-side engagement for a regional carrier, we rebuilt lane-level profitability, analyzed contract-versus-spot rate mix and fuel surcharge pass-throughs, and tested fleet replacement capex — giving the buyer a clear view of margins through the rate cycle.
Let's pressure-test the numbers together. A short conversation is often all it takes to see the path clearly.
Book an intro call